VSCode Debugger, something you haven't probably used yet
29 November 2023
Are you tired of sifting through numerous console.log() statements to debug your JavaScript applications? Look no further than the VSCode Debugger, a powerful tool built right into VSCode to streamline your debugging workflow.
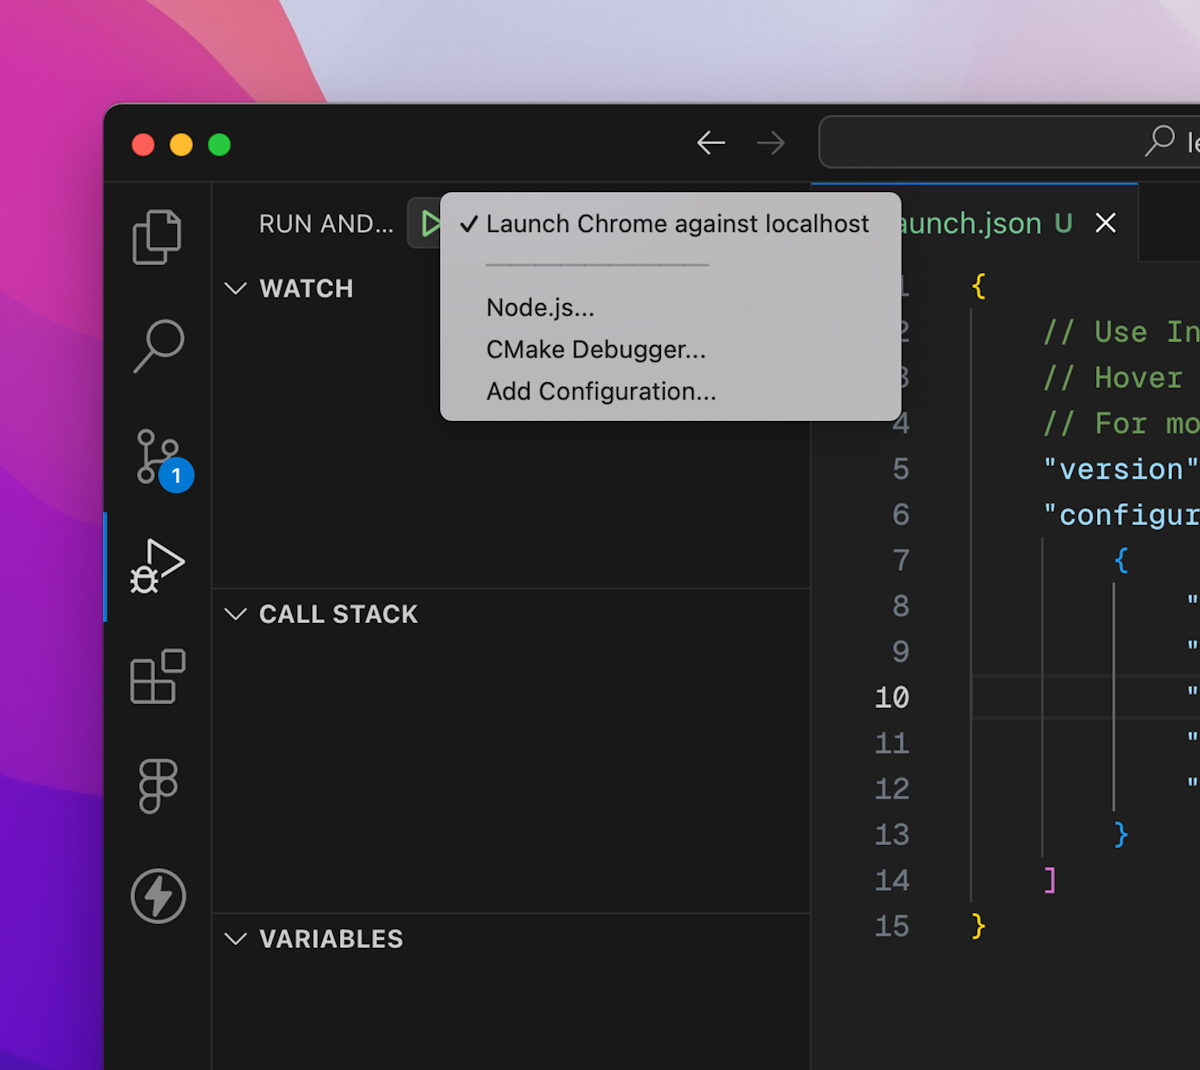
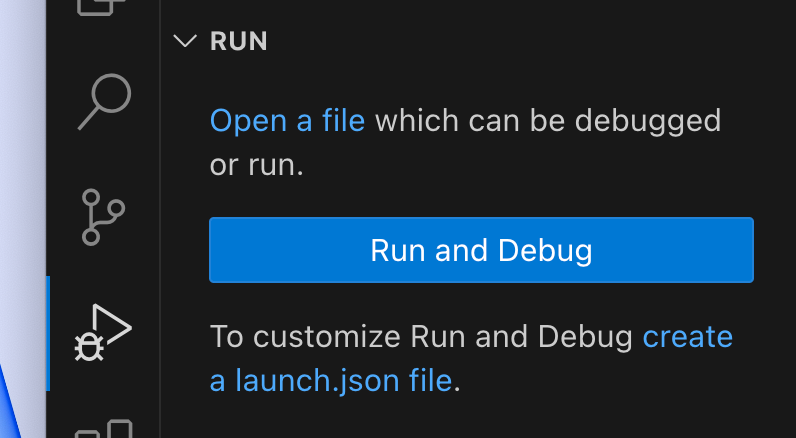
Getting started with the VSCode Debugger is straightforward. By clicking on the "Run and Debug" button from the menu, you'll be presented with a range of options to choose from based on the type of application you are working on. Whether it's a Node.js application or a web project like Next.js, the VSCode Debugger has got you covered.
For example, in a Next.js web project, you can set up the debugger to use a web browser like Chrome or, if you prefer, a different browser like Brave. Once the necessary configurations are in place, you can start the debugging process and open a new window to begin your debugging journey.
Example configuration for Chrome and Brave
{
    "version": "0.2.0",
    "configurations": [
        {
            "name": "Launch Chrome against localhost",
            "request": "launch",
            "type": "chrome",
            "url": "http://localhost:3000",
            "webRoot": "${workspaceFolder}"
        },
        {
            "type": "chrome",
            "request": "launch",
            "name": "Launch Brave against localhost",
            "url": "http://localhost:3000",
            "runtimeExecutable": "/Applications/Brave Browser.app/Contents/MacOS/Brave Browser",
            "userDataDir": true,
            "webRoot": "${workspaceFolder}"
        }
    ]
}
Setting breakpoints at specific lines within your code allows you to pause the execution and inspect the application state and data at that particular point. This method can be particularly useful when you want to examine the flow of operations and variables when certain actions are performed in the application.
With the VSCode Debugger, you gain access to the call stack, variables, and other crucial information without the need to toggle between your code editor and a browser's inspect tool. This makes it a seamless and efficient way to track and understand the behavior of your application during runtime.
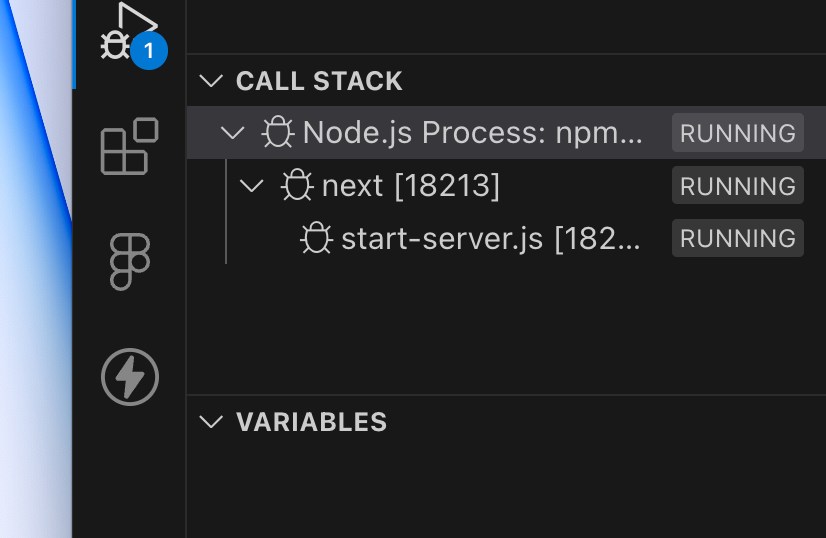
In a multiplayer game scenario, for example, you can set breakpoints at key points such as when a player joins the game or when an opponent joins the game, enabling you to closely monitor the application state and variables at those critical moments.
By utilizing the VSCode Debugger, you can effectively troubleshoot and inspect your application's internal workings without having to rely solely on console logs. This method not only simplifies the debugging process but also provides a more comprehensive and organized approach to understanding your application's behavior.
In conclusion, the VSCode Debugger serves as a valuable alternative to traditional console.log() debugging. It offers a more holistic view of the application's runtime behavior and provides a seamless way to diagnose and address issues without the clutter of excessive logs. Harness the power of the VSCode Debugger to elevate your JavaScript debugging experience and streamline your workflow.
So, why spend countless hours sorting through console logs when the VSCode Debugger provides a more efficient and organized way to debug your JavaScript applications?
Try it out and witness the difference in your debugging process. Happy debugging!
Haneen Mahdin
Design Engineer at Truelines